Revealing Patterns of Legislation in Congress
University of Washington
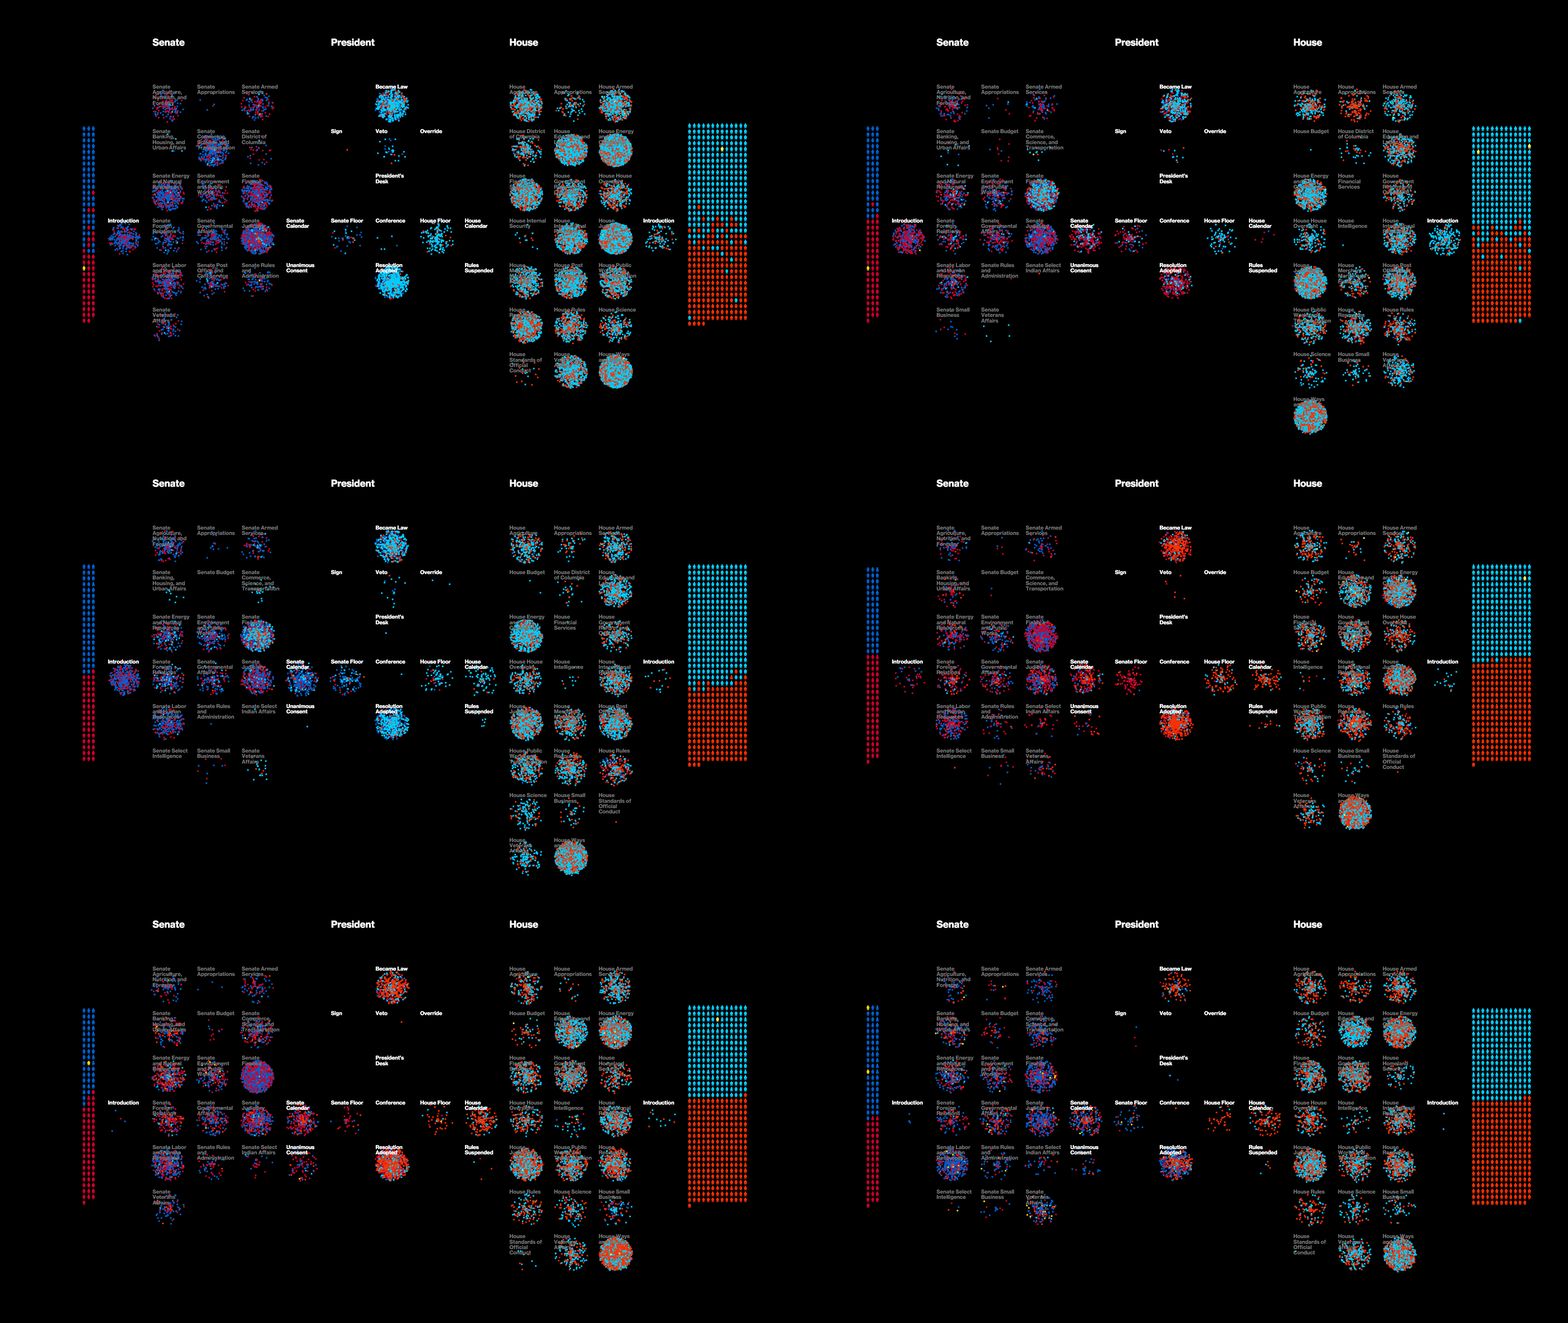
Legislative Explorer is an interactive data visualization that allows you to explore actual patterns of lawmaking in Congress over forty years. Schema collaborated with the Center for American Politics and Public Policy (CAPPP) at the University of Washington to realize the project. The visualization allows you to see the big picture of U.S. lawmaking by aggregating all bills and resolutions and following their progress from introduction to outcome. Additionally these bills and resolutions can be searched by and filtered according to topic, committee, chamber, party, and Congressional sponsor.
Legislative Explorer Process and Timeline

Process
Legislative Explorer began by focusing on the steps of the legislative process. The process for how a bill becomes law may initially seem like a linear process, but in reality it is anything but. Bills travel back and forth between the chambers and committees before only a select few end up on the President’s desk. We worked with CAPPP to conceptualize how to represent the non-linearity of the process, creating interactive prototypes using actual data to test our hypotheses.

Outcome
Legislative Explorer demonstrates the benefits of data-driven discovery to advance the understanding of complex legislative processes. At its core, the visualization consists of a map of the two chambers of Congress, the House and Senate, as well as the White House. Each step of the process is labeled on the map. Bills are represented as particles, color-coded by party. They are introduced by sponsors on either edge of the view. You can play-back the entire duration of a Congress and see bills move through the system, or apply filters to view subsets of legislation. Zooming in on the map lets you see the bills in more detail or link to a single bill on congress.gov. We later extended the initial visualization with a timeline view that examines patterns of lawmaking over time using a time-series graph. View the visualization.


